もうトレースコードは書かない!Cloudflare Workersの新機能「自動トレース」を検証

はじめに
CloudflareのWorkersにて自動トレースの機能がベータリリースされました。
Cloudflare Doc: https://developers.cloudflare.com/workers/observability/traces/
Cloudflare Blog: https://blog.cloudflare.com/ja-jp/workers-tracing-now-in-open-beta/
Workersのコードを変更することなく、自動でトレースの計測が可能になりました。
コードを変更する必要がないため、トレース用のコードを記述して複雑になったり、コードが肥大化したりすることもありません。
現在、自動で追跡できる要素は以下の通りです。
・binding
・fetch
・handler call
取得できるspanなどは以下に記載されてますので、参考にして下さい。
Cloudflare Doc: https://developers.cloudflare.com/workers/observability/traces/spans-and-attributes/
トレースのグラフはCloudflareの画面から確認が可能です。
また、OpenTelemetry互換プロバイダーにトレースデータを送信することもできるようになっています。
今回は実際に動かして、どのように使うのかを検証していこうと思います。
動作検証
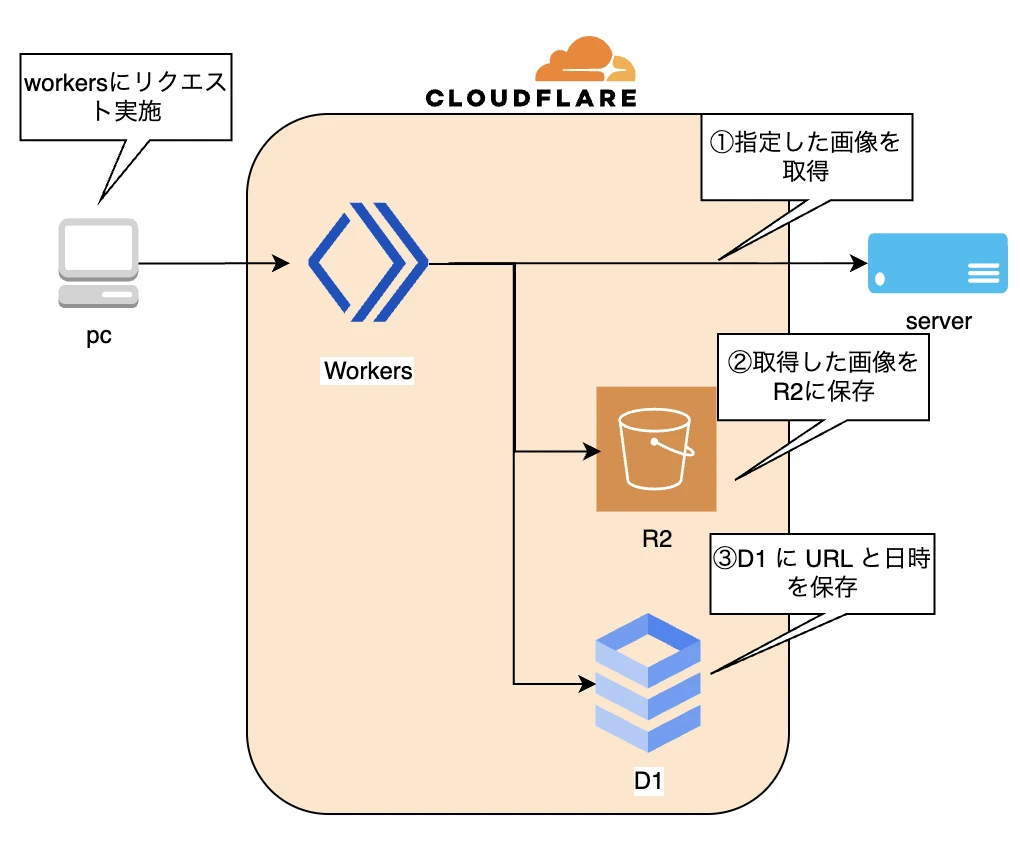
Workersにてインターネットから画像を取得し、R2に保存をします。
その情報をD1に保存する一連の処理で、トレースの検証をしてみます。
以下のコマンドでCloudflareにログインします。
以下のコマンドでR2を作成します。
以下のコマンドでD1を作成します。
tableを作成するために以下の内容を「schema.sql」というファイル名で作成します。
以下のコマンドでD1にtableを作成します。
ちなみに、WorkersのベストプラクティスがCloudflareのドキュメントに記載されてますので、参考にしてみて下さい。
Cloudflare Doc: https://developers.cloudflare.com/workers/best-practices/workers-best-practices/
まずWorkersを以下のコマンドで作成します。
選択した項目は以下の通りです。
※AGENTS.mdを作成するかどうかが問われるようになりました。今回は必須ではありませんが、念のため追加しています。
編集するためにディレクトリを移動して型定義ファイルを生成します。
tracesを有効にして、R2、D1をWorkersからbindingできるように設定を行います
D1のidはCloudflareの画面から確認が可能です。
以下の内容に編集をして下さい。
作成したWorkersをCloudflareに以下コマンドでdeployします。
workers.dev用のドメインを利用してリクエストを行います。
クエリパラメータのURLはインターネットに公開されている画像を指定して下さい。
例
エラーが発生しなければ、R2のimagesフォルダ内に画像が保存され、D1のテーブルに情報が書き込まれてるはずです。
R2
D1
Cloudflareの画面からトレースの画面に移動します。
Cloudflare login -> compute -> 観察可能性
span名をクリックすると詳細情報の確認も可能です。
コード内にトレース用のコードなどを記載しなくても自動で情報が取得できていることが確認できました。
Honeycomb、Grafana、Sentryなどのプロバイダー、または利用可能なエンドポイントを持つその他の OpenTelemetry プロトコル(OTLP)プロバイダーに直接トレースのデータを送信することが可能です。
Cloudflare Blog: https://blog.cloudflare.com/ja-jp/workers-tracing-now-in-open-beta/#opentelemetryhu-huan-purobaidanitoresuwoekusupoto
以下のような構成でGrafana環境をGoogle Cloud内に作成し、Cloudflareからトレース、ログデータの送信が可能か試してみました。

Google Cloud内のGCEにDockerコンテナでnginx、otel connector、tempo、lokiやgrafanaなどを構築しました。
今回は内部の細かいところには触れませんが、構成として参考になれば幸いです。
また、送信先のnginxに名前で到達できるよう、DNSにて名前解決できるように登録もしてます。
そして、HTTPSで送信するためにSSL証明書をnginxに設定しています。
Compute -> 観察可能性に移動して、ターゲットタブに移動します。
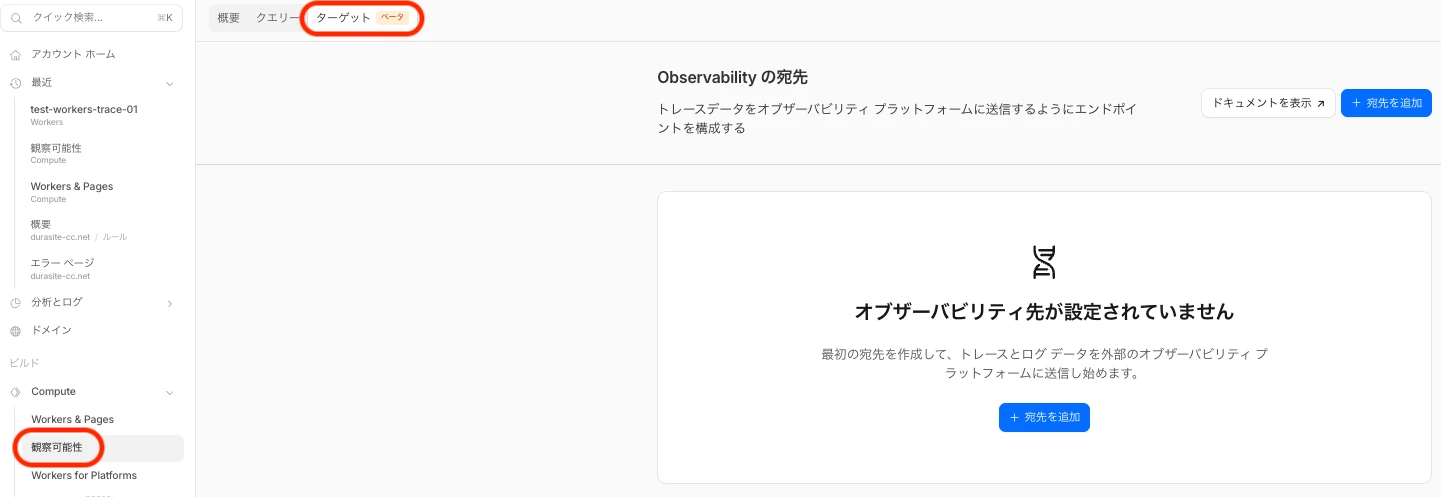
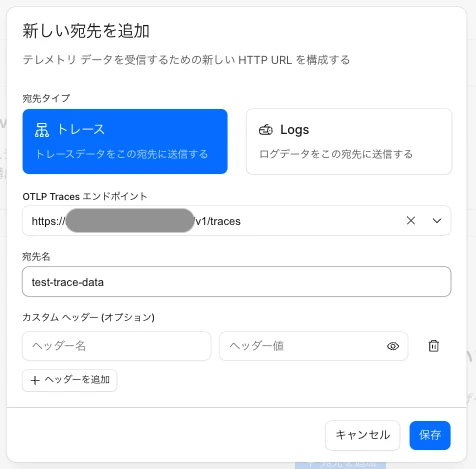
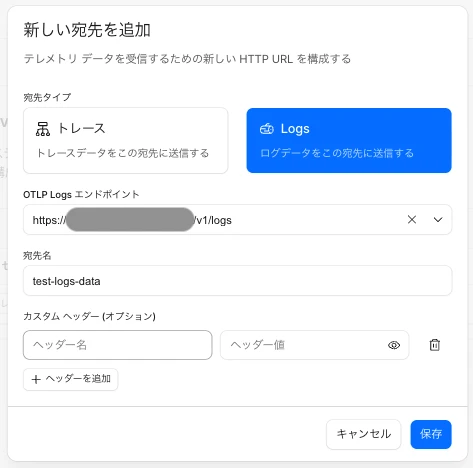
トレースと、ログのデータを転送する先を登録します。
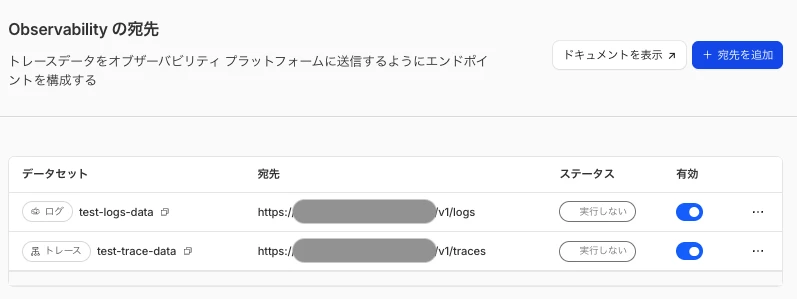
登録が完了すると、以下のように表示されます。
ステータスが変更になるまで時間が少しかかりますので待ちます。
ここの部分でステータスがなかなか変更にならず、データの送信ができない状態になりました。
まだベータ版なので今後の調整が入ることを期待したいです。
正常にデータの送信ができると、以下のようにgrafanaからトレースデータやログデータの確認ができることを確認できてます。
・トレースデータ
・ログデータ
その情報をD1に保存する一連の処理で、トレースの検証をしてみます。
今回の検証の構成図
wranglerでCloudflareにログイン
以下のコマンドでCloudflareにログインします。
$ npx wrangler login
$ npx wrangler whoami
R2バケットの作成
以下のコマンドでR2を作成します。
$ npx wrangler r2 bucket create test-workers-trace-bucket
D1の作成
以下のコマンドでD1を作成します。
$ npx wrangler d1 create test-workers-trace-d1
tableを作成するために以下の内容を「schema.sql」というファイル名で作成します。
CREATE TABLE IF NOT EXISTS image_logs (
  id TEXT PRIMARY KEY,
  requested_at TEXT NOT NULL,
  url TEXT NOT NULL,
  r2_key TEXT NOT NULL
);
以下のコマンドでD1にtableを作成します。
$ wrangler d1 execute test-workers-trace-d1 --remote --file=./schema.sql
自動トレース検証用のWorkers作成
ちなみに、WorkersのベストプラクティスがCloudflareのドキュメントに記載されてますので、参考にしてみて下さい。
Cloudflare Doc: https://developers.cloudflare.com/workers/best-practices/workers-best-practices/
Workersの作成
まずWorkersを以下のコマンドで作成します。
選択した項目は以下の通りです。
※AGENTS.mdを作成するかどうかが問われるようになりました。今回は必須ではありませんが、念のため追加しています。
$ npm create cloudflare@latest -- test-workers-trace-01

├ What would you like to start with?
│ category Hello World example
│
├ Which template would you like to use?
│ type Worker only
│
├ Which language do you want to use?
│ lang TypeScript
│
├ Do you want to add an AGENTS.md file to help AI coding tools understand Cloudflare APIs?
│ yes agents
│
├ Do you want to use git for version control?
│ yes git
│
├ Do you want to deploy your application?
│ no deploy via `npm run deploy`
編集するためにディレクトリを移動して型定義ファイルを生成します。
cd test-workers-trace-01
$ npx wrangler types
wrangler.jsoncの編集
tracesを有効にして、R2、D1をWorkersからbindingできるように設定を行います
D1のidはCloudflareの画面から確認が可能です。
"$schema": "node_modules/wrangler/config-schema.json",
	"name": "test-workers-trace-01",
	"main": "src/index.ts",
	"compatibility_date": "2026-02-17",
	"observability": {
		"traces": {
			"enabled": true,
		},
	},
	"compatibility_flags": ["nodejs_compat"],
	"r2_buckets": [
		{
			"binding": "BUCKET",
			"bucket_name": "test-workers-trace-bucket",
		},
	],
	"d1_databases": [
		{
			"binding": "DB",
			"database_name": "test-workers-trace-d1",
			"database_id": "xxxxx-xxxxx-xxxxx-xxxxx-xxxxx",
		},
	],
}
src/index.tsの編集
以下の内容に編集をして下さい。
export interface Env {
	BUCKET: R2Bucket;
	DB: D1Database;
}

export default {
	async fetch(req: Request, env: Env): Promise<Response> {
		const u = new URL(req.url);

		const raw = u.searchParams.get('url');
		if (!raw) return new Response('missing url', { status: 400 });

		let target: URL;
		try {
			target = new URL(raw);
			if (!['http:', 'https:'].includes(target.protocol)) {
				return new Response('invalid url protocol', { status: 400 });
			}
		} catch {
			return new Response('invalid url', { status: 400 });
		}

		// 1) 外部取得(fetch)
		const res = await fetch(target.toString(), { headers: { 'user-agent': 'r2-d1-demo' } });
		if (!res.ok) return new Response(`upstream error: ${res.status}`, { status: 502 });

		const contentType = res.headers.get('content-type') ?? 'application/octet-stream';
		const buf = await res.arrayBuffer();

		const now = new Date().toISOString();
		const id = crypto.randomUUID();
		const key = `images/${now.replace(/[:.]/g, '-')}_${id}`;

		// 2) R2 保存(binding)
		await env.BUCKET.put(key, buf, { httpMetadata: { contentType } });

		// 3) D1 に URL と日時を保存(binding)
		await env.DB.prepare('INSERT INTO image_logs (id, requested_at, url, r2_key) VALUES (?, ?, ?, ?)')
			.bind(id, now, target.toString(), key)
			.run();

		return Response.json({ id, requestedAt: now, url: target.toString(), r2Key: key });
	},
};
workersのdeploy
作成したWorkersをCloudflareに以下コマンドでdeployします。
$ npx wrangler deploy
workersにリクエスト実施
workers.dev用のドメインを利用してリクエストを行います。
クエリパラメータのURLはインターネットに公開されている画像を指定して下さい。
例
$ curl "https://test-workers-trace-01.xxxxxx.workers.dev?url=https://www.xxx.net/images/001.png"

{"id":"xxx-xxx-xxx","requestedAt":"2026-02-18T09:02:00.520Z","url":"https://www.xxx.net/images/001.png","r2Key":"images/2026-02-18T09-02-00-520Z_xxx-xxx-xxx"}
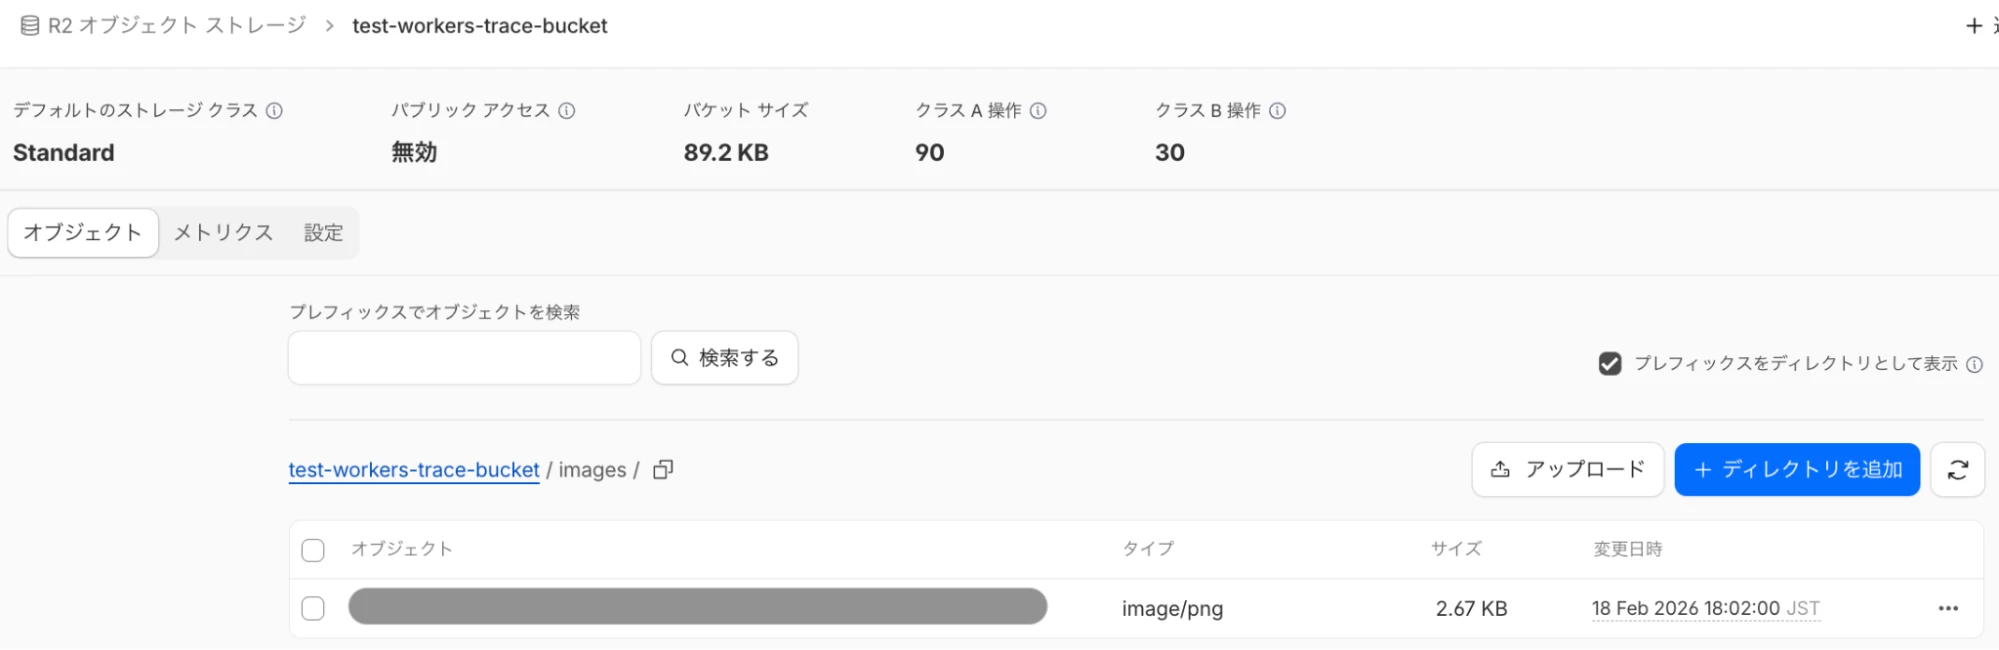
エラーが発生しなければ、R2のimagesフォルダ内に画像が保存され、D1のテーブルに情報が書き込まれてるはずです。
R2
D1
$ wrangler d1 execute test-workers-trace-d1 --remote --command="SELECT * FROM image_logs ORDER BY requested_at DESC LIMIT 50;" --json

...
      {
        "id": "xxxx-xxxx-xxxx",
        "requested_at": "2026-02-18T07:44:20.410Z",
        "url": "ttps://www.xxx.net/images/001.png",
        "r2_key": "images/2026-02-18T07-44-20-410Z_xxxx-xxxx-xxxx"
トレースの確認
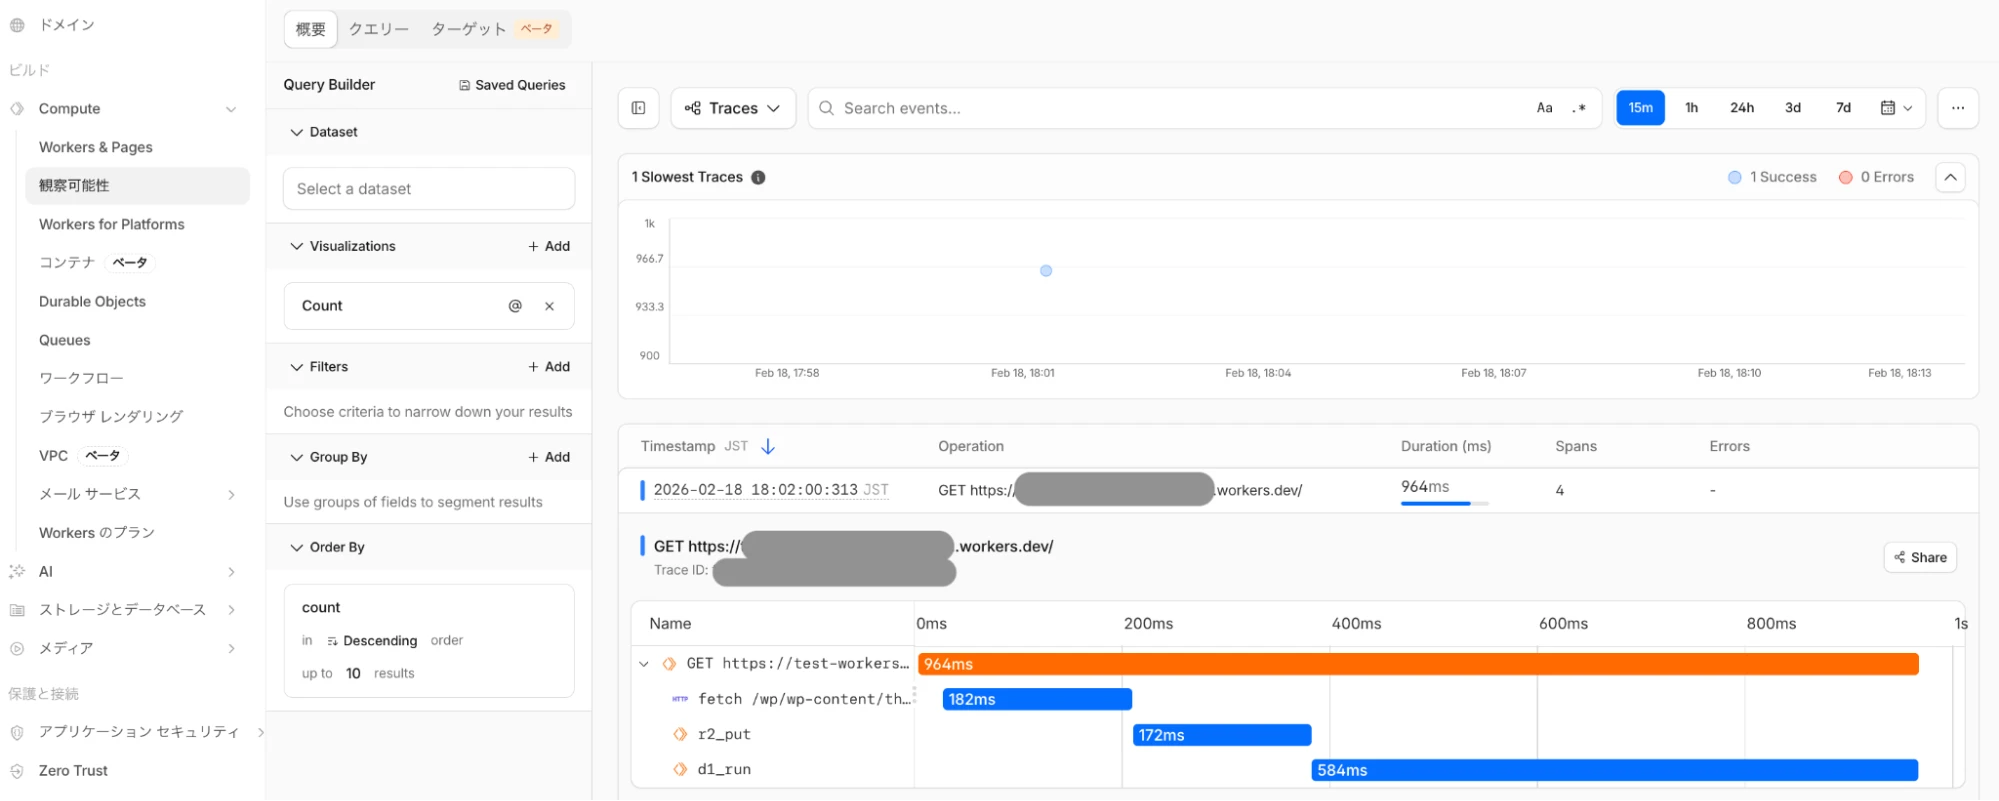
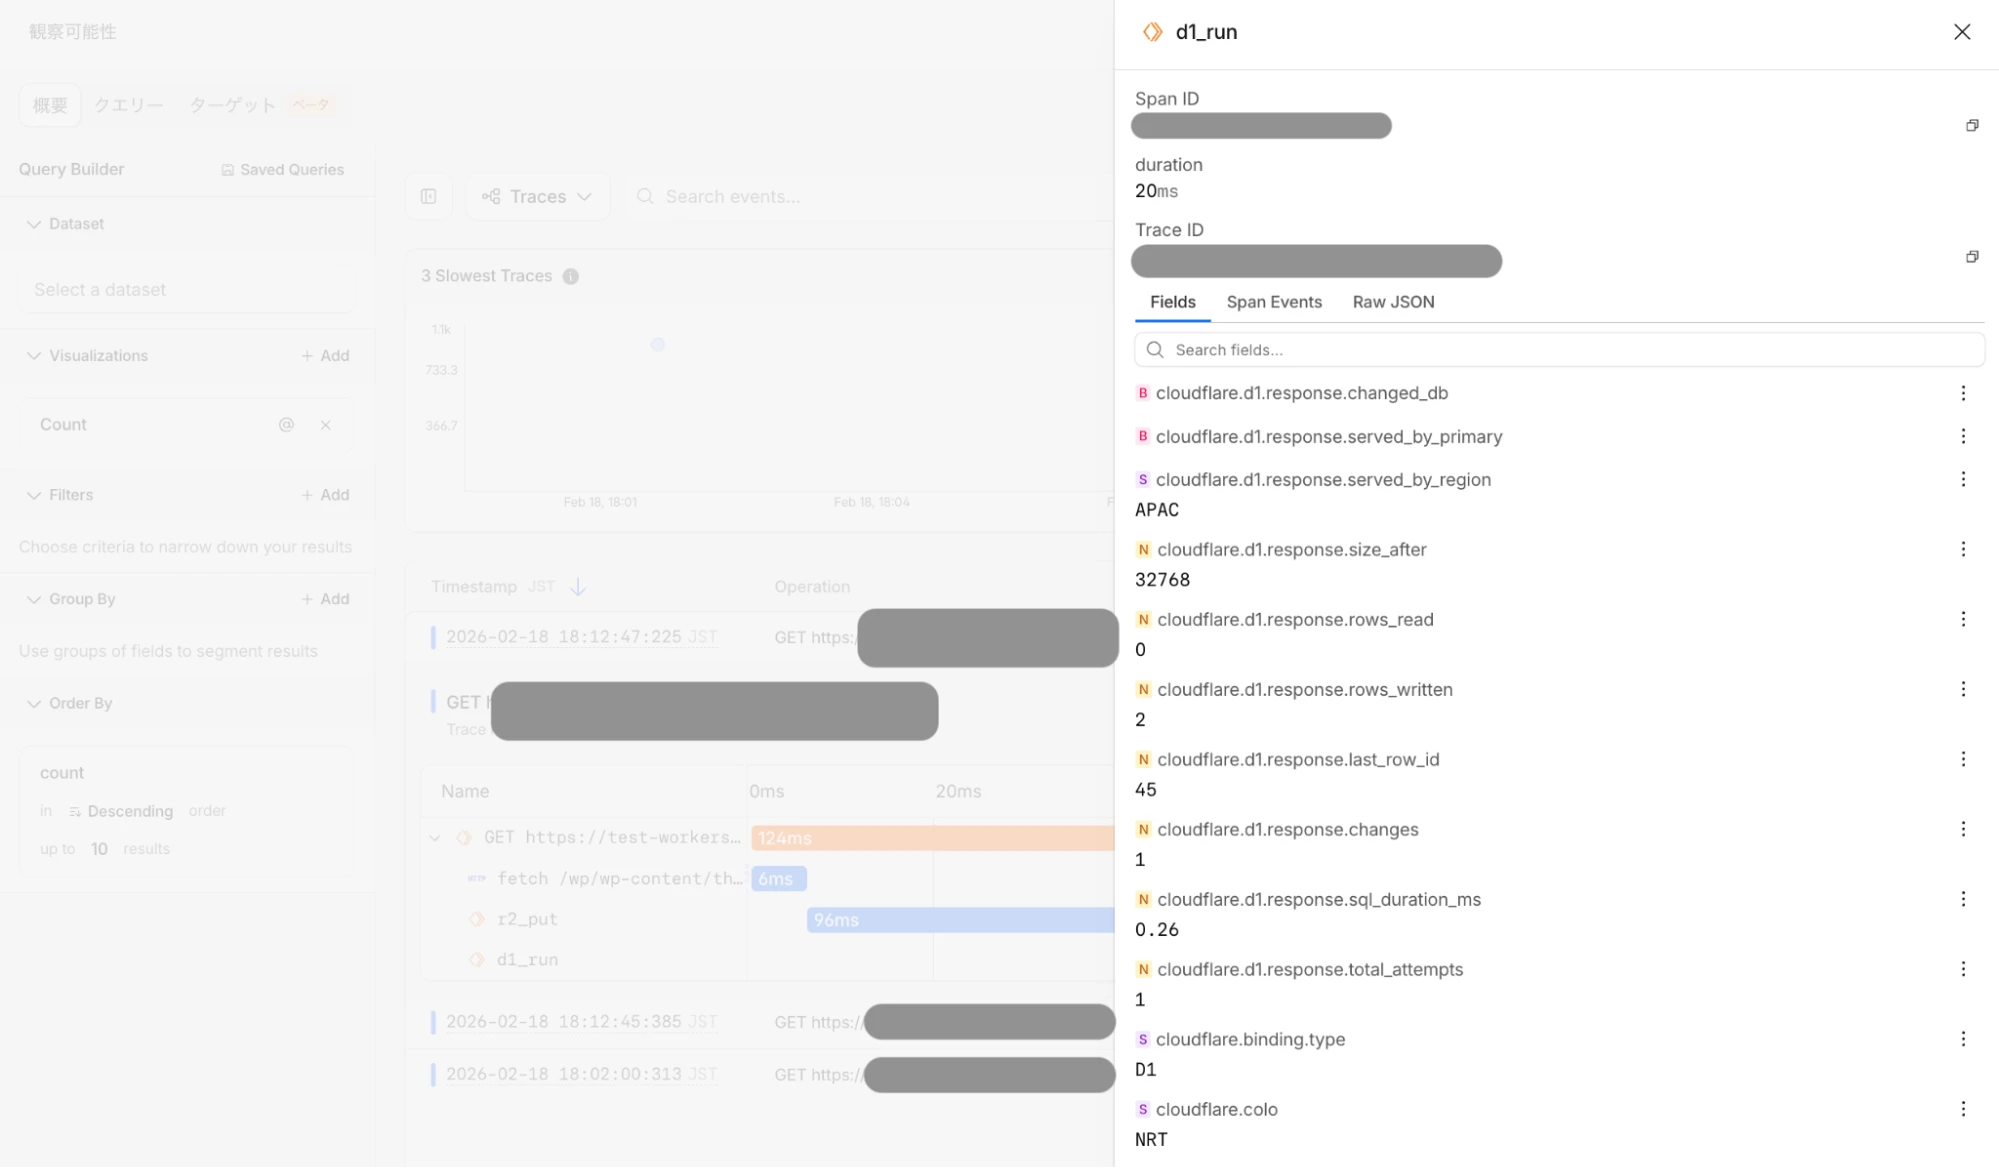
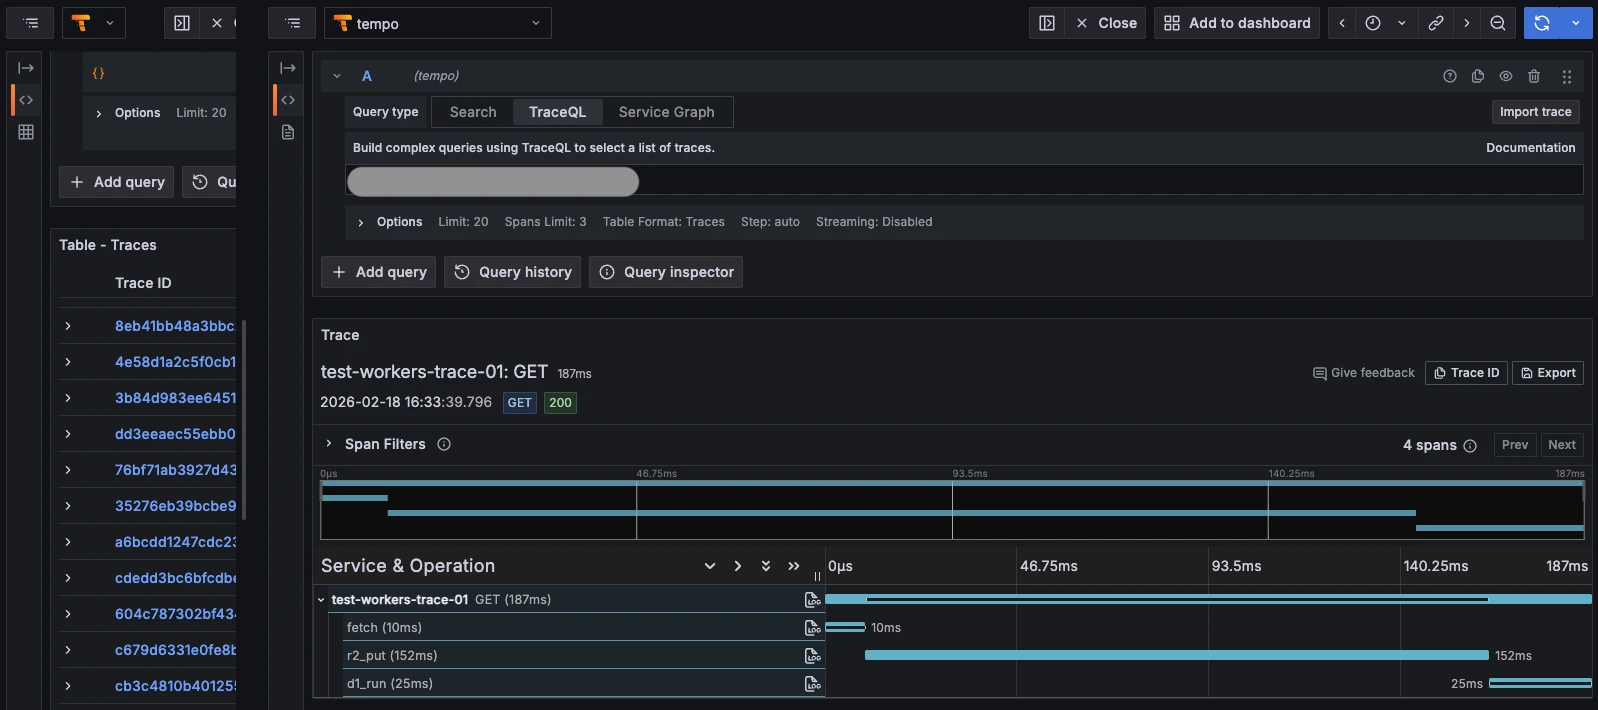
Cloudflareの画面からトレースの画面に移動します。
Cloudflare login -> compute -> 観察可能性
span名をクリックすると詳細情報の確認も可能です。
コード内にトレース用のコードなどを記載しなくても自動で情報が取得できていることが確認できました。
トレースデータを外部に送信
Honeycomb、Grafana、Sentryなどのプロバイダー、または利用可能なエンドポイントを持つその他の OpenTelemetry プロトコル(OTLP)プロバイダーに直接トレースのデータを送信することが可能です。
Cloudflare Blog: https://blog.cloudflare.com/ja-jp/workers-tracing-now-in-open-beta/#opentelemetryhu-huan-purobaidanitoresuwoekusupoto
以下のような構成でGrafana環境をGoogle Cloud内に作成し、Cloudflareからトレース、ログデータの送信が可能か試してみました。
Google Cloud内のGCEにDockerコンテナでnginx、otel connector、tempo、lokiやgrafanaなどを構築しました。
今回は内部の細かいところには触れませんが、構成として参考になれば幸いです。
また、送信先のnginxに名前で到達できるよう、DNSにて名前解決できるように登録もしてます。
そして、HTTPSで送信するためにSSL証明書をnginxに設定しています。
トレースデータ、ログデータの送信
Compute -> 観察可能性に移動して、ターゲットタブに移動します。
トレースと、ログのデータを転送する先を登録します。
登録が完了すると、以下のように表示されます。
ステータスが変更になるまで時間が少しかかりますので待ちます。
ここの部分でステータスがなかなか変更にならず、データの送信ができない状態になりました。
まだベータ版なので今後の調整が入ることを期待したいです。
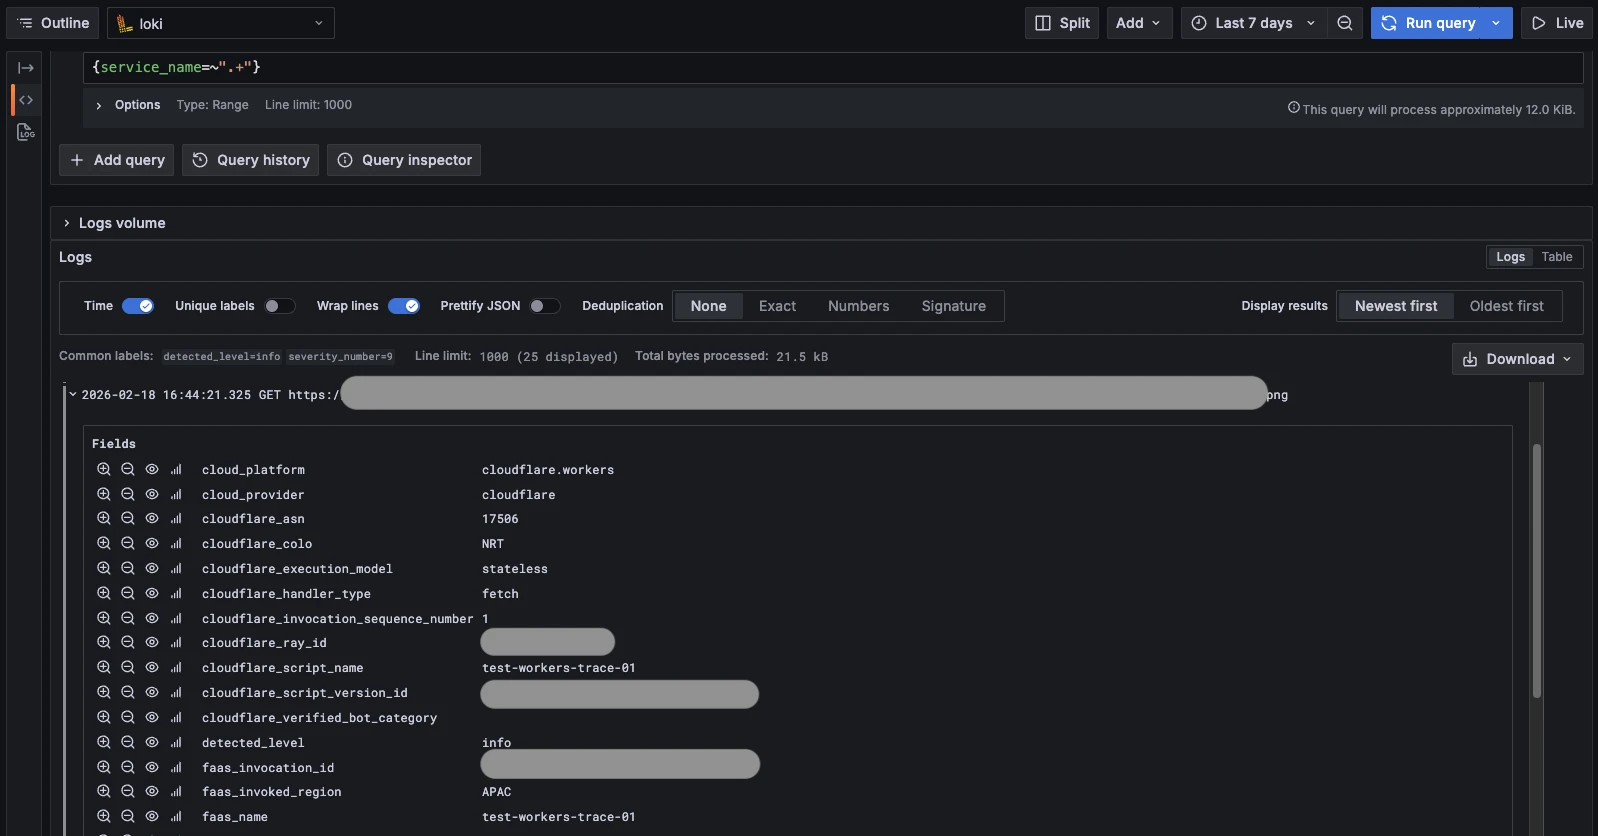
正常にデータの送信ができると、以下のようにgrafanaからトレースデータやログデータの確認ができることを確認できてます。
・トレースデータ
・ログデータ
今後のロードマップ
今後数ヶ月以内に以下機能のリリースを予定しているとのことです。
・より多くのスパンと属性のサポート
・トレースコンテキストの伝達
・カスタム範囲と属性のサポート
Cloudflare blog: https://blog.cloudflare.com/ja-jp/workers-tracing-now-in-open-beta/#workersnoke-guan-ce-xing-gadeng-chang
現状では使いたくてもスパンが存在しないため、自動トレースの対象外となってしまうケースもあるかと思います。
今後より多くのスパンが増える予定であることは嬉しい点です。
また、自動計測だけでなく、アプリケーション独自のロジックに関するカスタムトレースデータも取得できるようになる予定です。
(カスタムトレースについては、自動トレースではなく、自身でトレースのコードを記述する必要が出てくるとは思いますが。)
値段
初期ベータ期間中は無料ですが、2026年3月からは有料となっておりますので、詳細は以下のページからご確認下さい。
Cloudflare Doc: https://developers.cloudflare.com/workers/observability/traces/#limits--pricing
Cloudflare Doc: https://developers.cloudflare.com/workers/observability/traces/#limits--pricing
最後に
簡単ですがWorkersの自動トレース機能を検証してみました。
まだベータ版の機能ですが、
コードの中にトレース用のコードを書かなくてよいので、コード自体の複雑さが減るのは嬉しいです。
また、トレースデータ自体をCloudflareの画面で確認できるのも嬉しいです。
外部のGrafanaなどにデータを送信して、使い慣れた環境で確認する方法もありますが、運用管理の観点から考えると、Cloudflareの画面一つで確認できるのはメリットが大きいと感じます。
そしてCloudflareなら上記以外でも、
・パフォーマンスの向上
・サイトの信頼性の向上
・セキュリティの向上
が、一つのサービスで実現できますので非常におすすめです。
まだベータ版の機能ですが、
コードの中にトレース用のコードを書かなくてよいので、コード自体の複雑さが減るのは嬉しいです。
また、トレースデータ自体をCloudflareの画面で確認できるのも嬉しいです。
外部のGrafanaなどにデータを送信して、使い慣れた環境で確認する方法もありますが、運用管理の観点から考えると、Cloudflareの画面一つで確認できるのはメリットが大きいと感じます。
そしてCloudflareなら上記以外でも、
・パフォーマンスの向上
・サイトの信頼性の向上
・セキュリティの向上
が、一つのサービスで実現できますので非常におすすめです。
Cloudflareに、アクセリアの運用サポートをプラスしたCDNサービスを提供しています
アクセリア自社CDNの開発と運用は、20年以上にわたります。それらの経験とノウハウを駆使したプロフェッショナルサポートをパッケージしたサービスが、[Solution CDN]や[Solution GateCore]です。
移行支援によるスムーズな導入とともに、お客様の運用負担を最小限にとどめながら、WEBサイトのパフォーマンスとセキュリティを最大限に高めます。運用サポートはフルアウトソーシングからミニマムサポートまで、ご要望に合わせてご提供します。
Cloudflare(クラウドフレア)の導入や運用について、またそれ以外のことでもなにか気になることがございましたらお気軽にご相談下さい。

移行支援によるスムーズな導入とともに、お客様の運用負担を最小限にとどめながら、WEBサイトのパフォーマンスとセキュリティを最大限に高めます。運用サポートはフルアウトソーシングからミニマムサポートまで、ご要望に合わせてご提供します。
Cloudflare(クラウドフレア)の導入や運用について、またそれ以外のことでもなにか気になることがございましたらお気軽にご相談下さい。
杉木 俊文
技術本部 プラットフォーム部


Contact usお問い合わせ
サービスにご興味をお持ちの方は
お気軽にお問い合わせください。
Webからお問い合わせ
お問い合わせお電話からお問い合わせ
03-5211-7750
平日09:30 〜 18:00